The Warehouse Crystal Ball: Using AI to Predict Demand Before It Happens
Tired of running out of bestsellers while sitting on slow-moving stock? Learn how AI-powered demand forecasting calculates sales velocity per SKU, surfaces confidence-scored predictions, and turns forecasting intelligence into one-click purchase orders.
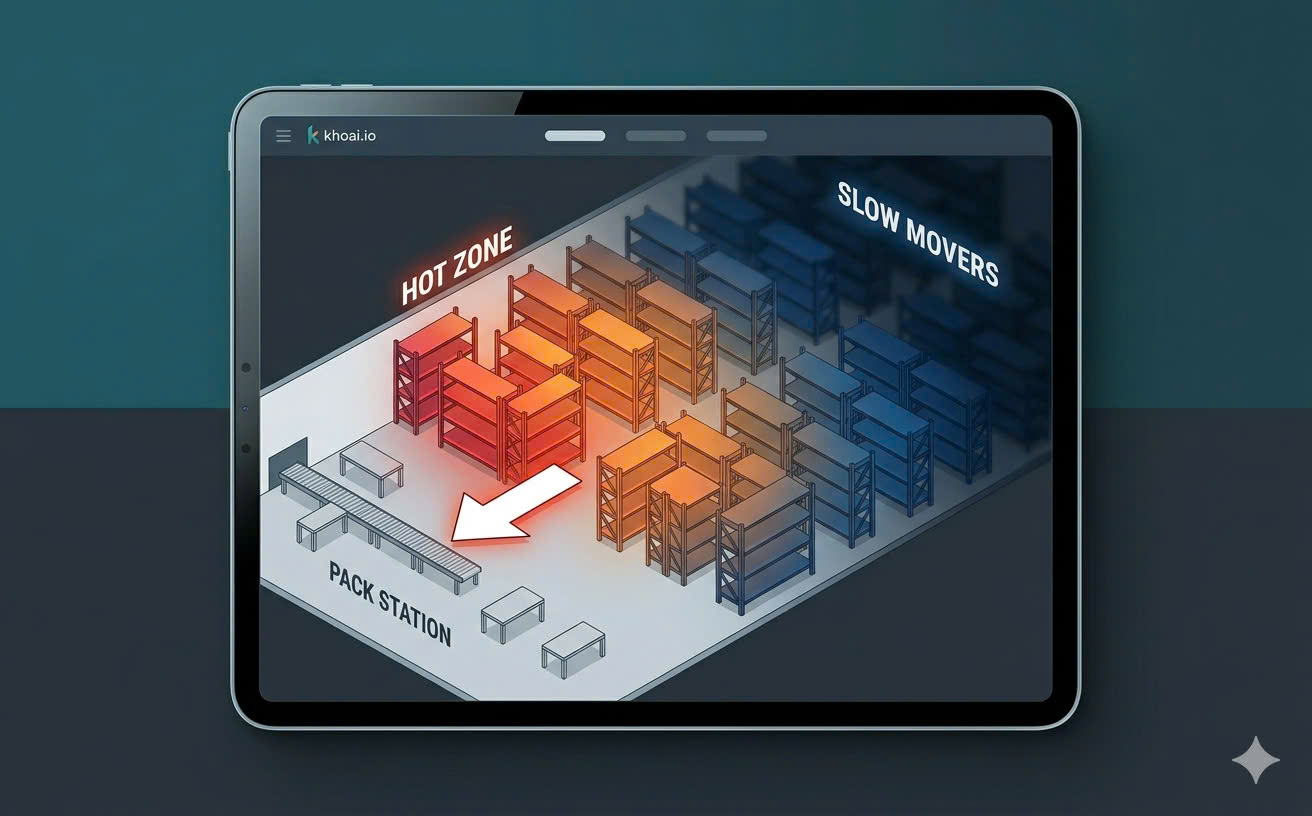
It's Wednesday afternoon. You're standing in front of Shelf B-07 — home to your single best-selling SKU — staring at empty air. The shelf has been bare since Sunday. Three days of orders have come in; three days of customers have been told “out of stock.” The replacement shipment won't arrive until Friday at the earliest.
Two aisles over sits a pallet of a product you overstocked four months ago, which hasn't moved once since. You paid to store it. You paid freight to receive it. And you're still paying both costs every day it doesn't sell.
This is the double-edged sword of reactive inventory: you run out of what sells and drown in what doesn't. It isn't a purchasing mistake. It's a visibility mistake — and it's the exact problem AI forecasting is designed to eliminate.
The Mismatch Penalty: Calculating What “Getting It Wrong” Actually Costs
Most warehouse operators think of stockouts and overstock as occasional inconveniences. They're not. They're a persistent, quantifiable tax on your margins — one you can measure.
Cost of a Stockout
- ✗ Lost sale revenue (immediate)
- ✗ Customer switches to a competitor
- ✗ Expedited shipping to recover
- ✗ Negative review or refund request
- ✗ Staff time managing apologies
Cost of Overstock
- ✗ Capital tied up in unsold goods
- ✗ Storage space at premium cost per m²
- ✗ Risk of spoilage or obsolescence
- ✗ Insurance on excess inventory
- ✗ Markdown pressure to clear stock
The harsh math: a single bestseller stockout of three days across 20 orders per day at an average order value of $20 is $1,200 in lost revenue in one week. Not a bad month. One shelf. One week.
The goal of AI forecasting isn't to be a trendy feature — it's to collapse that number toward zero.
Why Last Month's Average Is the Wrong Number
Traditional reorder logic works like this: you calculate average monthly sales, set a reorder point at “2 weeks of stock,” and check it manually at the end of each month. This was reasonable in 2005. It's a liability in 2026.
Here's why. Averages smooth everything out — including the signals that matter most:
- A product that sold 10 units in January, 10 in February, and 80 in March has an “average” of 33 — a number that perfectly describes no month.
- A regional holiday that doubles foot traffic in your area for two weeks doesn't appear in last year's data if you were closed or smaller.
- A competitor going out of business last quarter sends a wave of new customers your way — a one-time event that simple trend models will assume is permanent.
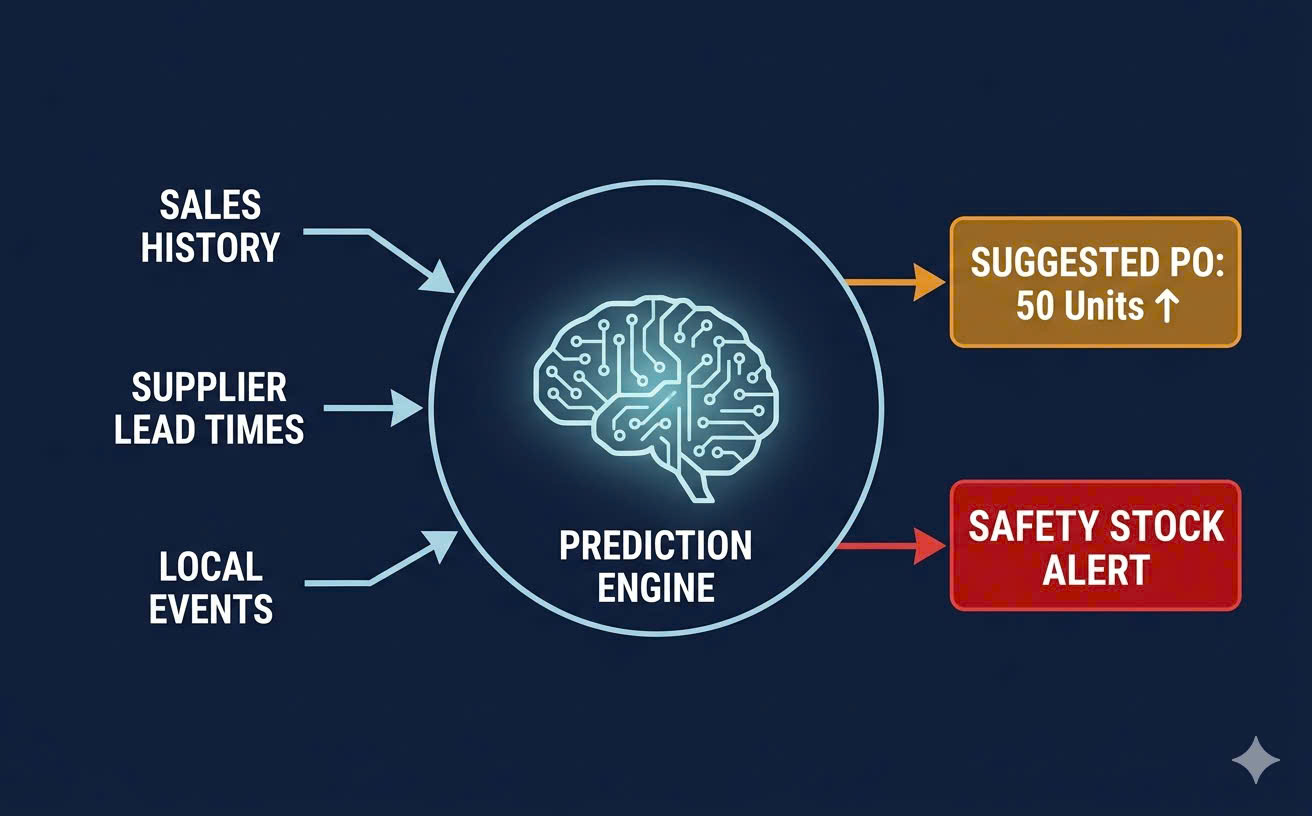
AI-powered forecasting doesn't use a single average. It continuously recalculates sales velocity per SKU — how fast each product is actually moving right now, weighted against seasonality patterns, recent trend shifts, and supplier lead times — all simultaneously.
Dynamic Velocity: The Number That Changes Every Day
Velocity isn't a fixed property of a product — it's a live measurement. A product that sold 2 units per day last month might be running at 8 units per day this week after a social media mention from a local influencer. A product that always moved well in the summer might already be slowing as autumn approaches.
When your system tracks velocity in real time, reorder points aren't calculated once a month — they update continuously. The system doesn't wait for you to notice the shelf is almost empty. It calculates: “At current velocity, this SKU will reach zero in 4 days. Supplier lead time is 5 days. A reorder is overdue.”
That shift — from reactive stockouts to proactive restocking — is the entire value proposition of AI-powered inventory.
The Hidden Correlations No Spreadsheet Can Surface
Here's the kind of insight that illustrates where inventory AI is heading — and why the gap between spreadsheet management and data-driven systems keeps widening:
The type of pattern advanced AI surfaces
“When Product A (a premium cleaning solvent) sells on Tuesday, Product B (a refill pack for the same line) reliably spikes on Thursday — with a 78% correlation across the last 6 months.”
A human reviewing a spreadsheet sees two separate SKUs. An AI system sees a paired buying pattern with a 48-hour lag — and can flag it as a restocking signal before the shelf empties. This is the frontier of what inventory intelligence is being built to do.
Your catalog likely contains dozens of patterns like this: seasonal bundles, complementary SKUs, products that react to the same promotions. The first step toward surfacing them is having accurate per-SKU velocity data in the first place — which is exactly where Khoai starts.
The Supplier Reliability Score: Knowing Which Lead Times to Actually Trust
Here's a decision every warehouse manager makes intuitively but rarely measures: your supplier says they deliver in 5 days. Do you believe them? Do you reorder 6 days before you need the stock — or 12, just in case?
Khoai calculates a supplier reliability score (0–100) for each of your suppliers, derived from the consistency of their actual historical delivery times. A supplier who delivers in 4–6 days every time scores near 100. One whose lead times swing between 3 days and 18 days scores much lower.
That score has a direct, concrete effect on your reorder point calculations:
- High reliability (80–100): reorder window is calculated against their stated lead time — you can cut it close.
- Medium reliability (40–79): a safety buffer is applied automatically — the reorder alert fires earlier than you might expect.
- Low reliability (below 40): urgency tiers activate sooner and suggested reorder quantities increase to cover potential delivery gaps.
The result: you stop making gut-feel judgments about which supplier to trust this week. The data tells you — and the reorder logic adjusts automatically around it.
From Forecast to Purchase Order: Closing the Loop in One Click
Knowing you need to reorder is only half the job. The other half is actually doing it — which, in most manual operations, means opening a supplier contact, writing up a request, cross-checking which items are running low, and confirming delivery windows. For a warehouse with 200 active SKUs, that process can consume hours every week.
When AI analytics are connected directly to your supplier catalog, the forecast becomes a pre-filled purchase order: SKU, quantity, preferred supplier, expected lead time. The manager reviews it, makes any adjustments, and approves with a single confirmation. The preparation work is done automatically.
The result isn't just efficiency — it's consistency. Manual purchasing is subject to whoever happened to do the reorder that week and what they remembered to check. Automated, AI-driven purchasing is consistent every time, for every SKU, regardless of who is on shift.
You Don't Need a Large Catalog to Start
A common hesitation: “we don't have enough data for AI to be useful yet.” This is true for training a model from scratch — but not for a system that ships with pre-built forecasting models tuned to general retail patterns.
The practical approach: start with your top 20 fastest-moving SKUs. Get velocity tracking and reorder alerts running for those. Within two to four weeks, the system has enough of your own real data to meaningfully improve its predictions for those specific products. Then expand to the next 50.
AI forecasting isn't a flip-a-switch transformation. It's a compounding advantage — one that gets more accurate the longer it runs with your real operational data. The best time to start was six months ago. The second best time is today.
Stop reacting. Start predicting.
Khoai's AI analytics surface real-time sales velocity, flag reorder opportunities before stockouts happen, and generate supplier purchase orders automatically. Start free — no credit card required.
Try Khoai free →